Happy Sunday, Everyone!
This week’s issue is focused on the intersection of three of my favorite topics: investing, poker & advertising. While the relationships between them are probably non-apparent at the outset, under the surface, there’s a lot in common:
- Non-Ergodicity
- Proper Allocation
- Power Laws
In fact, I’d go as far as to say that a true, intuitive understanding of each of these concepts is a necessary condition for success in digital advertising. Most people running ads don’t understand one of them; few understand all three, and even fewer grasp the connections between each concept.
Ergodicity, or Why Expected Value Is Dangerous
In classical mathematics and statistics, a system is considered ergodic if a point in a dynamic system will visit all possible points the system moves in, at a random and uniform rate. That’s a complex way of saying: in an ergodic system, the long-run average of samples from a process represents the average statistical properties of the entire process.
Most of us have been trained to think that virtually everything is ergodic - as evidenced by finance gurus or economists talking about “expected value” or “expected returns”: over time, actual values converge to expected values. Every time you’ve heard a pundit on TV or a Twitter (err - X) guru say something like, “If you bought $10,000 of $Apple at IPO and held it, it’d be worth $5M today,” be skeptical. The only way this return happens is if you never pull money out (even when the price falls 25% or 50%), or when other parts of your portfolio crash, or when you lose your job or whatever.
Expected value only matters if you can play long enough to realize it.
Most social sciences assume ergodicity in far too many studies - and it’s wrong. Not misguided. Flat-out-wrong. This is a central tenant of Nassim Nicholas Taleb’s work (particularly in The Black Swan and Antifragile): people don’t understand in fact, virtually every human system is non-ergodic (and yes, that includes advertising).
To understand why, consider two different scenarios:
Scenario A:
100 Advertisers are given $1,000 to spend on Meta that day to sell a widget or generate leads or (who cares what). At the end of the day, we calculate the amount of money they’ve made. Some make money. Some lose money. Some are even. Let’s assume that, based on this data, we can calculate 2 things: (1) the average return was 89% AND (2) that 5% of advertisers went bust (i.e. lost everything). So, from the initial $100,000 (100*$1,000), we ended up with $189,000 at the end of the day.
Scenario B:
1 Advertiser is given $1,000 to spend on Meta for a period of 100 days. Each day, s/he comes back and reports on the amount of money made/lost. By day 16, our illustrious advertiser is up to over $26.508M (compounding really is a wonder of the world). But, on Day 17, he goes bust. Loses it all.
Does it matter that, in Scenario B, our advertiser turned $1,000 into $26.5M? Not on Day 18 (or any day after that). Why? Because he can’t continue to invest in Meta Ads, as s/he lost everything on Day 17. How did that happen? Well, probably as a result of consistently taking on excess risk (which was necessary to achieve an 89% return per day). And even if we pretend that the dreadful Day 17 never happened to our prodigious Meta Advertiser, the mathematical reality remains this: based on these parameters and this “all-in” strategy, this individual’s probability of total loss was still 100%.
To use Taleb’s terminology, Scenario A represents an ensemble probability (concerned with a collection of people) and Scenario B represents a time probability (concerned with a single individual through time). As you can see from the (obviously extreme) scenario above, in any case where sequence matters, your ability to achieve expected value outcomes is contingent on your ability to survive ruin. This is as true in advertising as it is in investing as it is in poker as it is in the markets: the only way you can be successful is to first be able to survive.
To put this in advertising context: it doesn’t matter how high your expected ROAS or ROI is if there’s a point where lower-than-expected short-term performance results in a cessation or reduction in advertising exposure. The instant that happens, your actual returns will be divorced from the long-term expected returns. In non-ergodic systems, there are impediments (read: failure, insolvency) that prevent you from continuing to make bets, and so you can’t reach your theoretical long-run expected value.
This is why I advocate for probabilistic forecasting and a “eyes on, hands off” approach in many situations: meddling as a result of short-term variability only serves to lock-in losses.
Andrew Faris wrote about this on Twitter a few months ago, where he shared that a specific creative was continuing to receive spend despite dreadful initial performance. Being a savvy advertiser who understands probability and trusted the mathematical models underpinning Meta Ads, Andrew let it run within the budget set - and sure enough, the initial “bad” performance turned out to be the result of randomness + volatility. Over the next week, the ad became one of the top performers in the account. Had he changed something - paused the ad, reduced the budget, tightened the bid caps - the only result would have been to lock in those losses, as the new constraints would have impeded the ability of the system to deliver the traffic which resulted in the future positive outcomes.
I’ve written that day trading in PPC (or any digital media platform run by machine learning) is a terrible life choice; this is one reason why that’s the case.
Compounding Risk
A related concept to ergodicity is the idea of compounding risk or serial exposure.
Perhaps the best example of this is smoking: a single cigarette has a negligible impact on your overall health. Sure, it’s not good for you, but, in the grand scheme of things, it might take a few minutes off your life. The same is true for a single drink, a single ATV ride, a single skipped workout, a single chip: each has a negligible impact on your overall health.
But it’s rarely - if ever - the case that you only ever have one (something Lays made into a wildly effective series of commercials way back when) drink, cigarette, chip, etc. The danger isn’t in one; it’s in serial, repeated exposures over time. The damage comes from a pack (or more) per day for 2 decades (146,000 cigarettes!), or from drinking while riding an ATV after skipping your workouts for a week. Risk compounds. The risk in our drinking + ATV riding + skipping workouts scenario isn’t the sum - it’s a product (or, likely, some exponential function of it).
But this isn’t a post about healthy lifestyle habits, it’s about advertising.
So, what are the drinking, smoking, ATV riding and skipping workout equivalents of ad accounts + marketing? There are quite a few:
- Outdated Account Structure
- Poor Keyword Management + Discovery
- Generic Creative
- Terrible Landers
- Lack of Experimentation
- Faulty Data Passback
- Mis-managed shopping feed
Each one, on its own, isn’t an account-killer. There are plenty of accounts that have one or two of these “risk-adding” properties that still perform well above the mean. But where things go wrong - where accounts collapse - is the stacking of these issues. Sure, maybe faulty data passback - on its own - increases failure rate by 1% (it is far greater, but let’s pretend).
Now, add on poor keyword management, generic creative and terrible landers, each of which we’ll assume (in isolation) increase your “failure rate” 1%. The end result isn’t a 4% increase to your failure rate; it’s closer to a 16% increase. The effects compound. Bad keywords + bad landers + bad data result in substantially more waste than any one of those risks individually.
In a system - like digital advertising - that is non-ergodic, anything that increases your risk of ruin (i.e. failure) disproportionately decreases your probability of ever realizing your expected value.
De-Risking + Allocation: The Kelly Criterion
In Scenario B from above, the 100% failure rate outcome from above is the inevitable result of two things: (1) substantial volatility and (2) significant exposure (i.e. spending all $26.5M on Meta Ads in a single day). To avoid this situation, we need a method to “right-size” the bets we’re making relative to the capital we have available: too large a bet, and a lower-than-expected return torpedoes your budget/P&L for the month/year (or worse, if you are working with startups or small businesses); too small a bet, and the impact of a “hit” is insignificant.
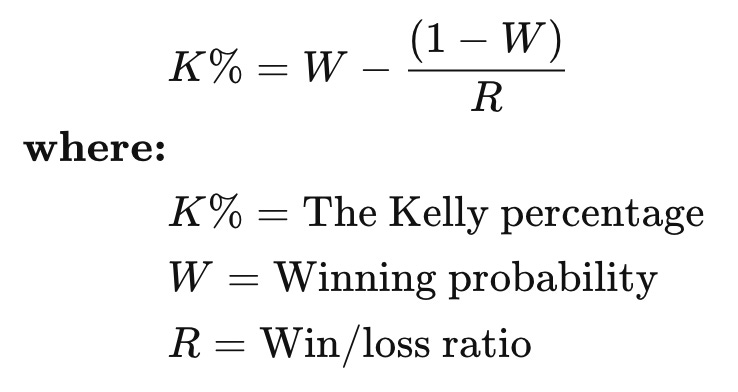
Enter the Kelly Criterion.
The Kelly Criterion is a principle first expressed by Bernoulli (in the 1700s!) and formalized by physicist JL Kelly. It’s used by many of the world’s top investors (including Warren Buffett) to determine capital allocation for future bets.
To translate these variables into advertising speak:
Kelly%: the percentage of your budget that should be allocated to the next investment (campaign, ad group, ad set, whatever)
W = your historical campaign “winning” percentage (i.e. the ratio of launched [investments] that were profitable / performed at or above target / total number of launched [investments] in this account. Thus, if you’ve launched 20 campaigns in total, and 12 performed at or above target, then you’d use 0.60 (12/20) as your value for W. Note: ensure you’re using the same definition as what you’re evaluating - so if you’re using this to determine budget for a campaign, then use “campaigns” here.
R = historical return on investment for the campaigns (this can be conversion value : cost or contribution margin : cost if you’re in eCommerce; if you’re in lead gen, calculate your total expected value for leads generated (sum of deal value * close probability), less any relevant expenses (10% sales team commission, for instance), and voila! You have “conversion value” for this purpose. Cost is pretty straightforward.
To provide a basic illustration, assume you have a $100,000 budget for marketing. Your W is 0.60 (12 successful campaigns out of 20 total launched). And your R = 4.25. Plugging those numbers into the Kelly Criterion gives .50588 - or $50,588 should be allocated to your next campaign. Conversely, if your success rate on campaigns is only 0.35 (7/20) and your R = 2.15, then you should only initially allocate 4.767% of your total budget, or $4,767 on your next campaign.
Power Laws:
You’ll notice a key word in the above: “initially” – that’s exceedingly intentional, and I’ll explain why in a minute.
But first: betting. In poker, 50% of all profits are attributable to five starting hands (AA, KK, QQ, JJ, AK Suited) - out of 169 possible non-equivalent starting hands (i.e. Ace of Hearts + Ace of Clubs = Ace of Diamonds + Ace of Spades).
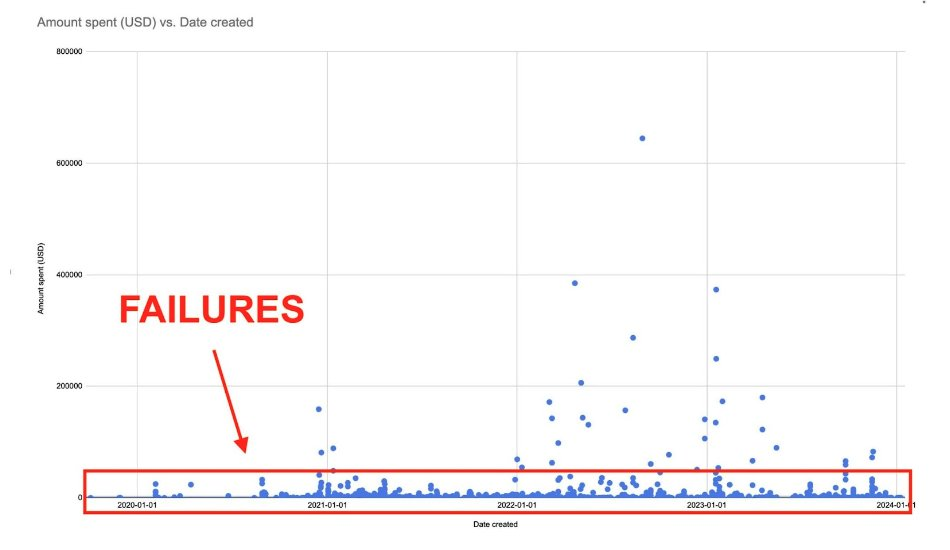
The same is true in advertising. The vast majority of ads fail. Across our accounts, we consistently see that a minuscule fraction of ads - 5%, 10% - account for 50%+ of the attributed revenue/conversion value (and of the spend).
That jives with Taylor Holiday & Common Thread Collective’s dataset for Bambu Earth (published here on May 28), showing a similar pattern:
This represents hundreds of ads – with only 6 spending more than $20,000 over a period of ~4 years. Faced with this reality, what is the rational response?
- Solve for Volume. The more creatives you put in market, the higher the probability that you’ll find winners. I wrote about this a few weeks ago here.
- Lose small, win big. Accept small losses as perfectly fine - if you spend 0.25% of your monthly budget on an ad and it bombs, who cares? The vast majority of your return will be produced by a handful of ads.
- Efficiency Is King. Relentlessly suppress your marginal cost (financial + time) of creative production - the less you need to spend creating each “shot”, the more shots you can produce per unit time.
- Feed The Bulls. Create a criterion for aggressive “follow-on” investment as soon as you spot a winner emerging.
- Keep Bet Size Constrained. The highest probability of failure comes from over-investing in losers. Until an ad/ad set/campaign actually demonstrates some measure of success, constrain the budget.
The notion that any entity - a creative agency, a media buyer, a strategist, an oracle - will be able to consistently create winners in a dynamic environment is foolhardy. It’s the worst kind of hubris: the kind that hurts those whom it purports to help.
In my experience (and in the data sets to which I have access), creative performance tends to follow a normal distribution, with ~95% within 2 standard deviations of the mean - and the mean isn’t nearly good enough. Tack on the fact that, of the remaining 5%, 50% is on the other (read: bad) side of the distribution, and you’re left with ~2.5% of ads as true game-changers.
Now, even if you suppose that a creative guru oracle savant wunderkind can 10x your hit rate (a 25% “outlier rate”) while producing 1x creative a week, that’s still not enough to compete with a team that can produce 100 ads a month. By the end of the year, that team producing 100 creatives that hit at ~2.5% is expected (there’s that word again) to produce 18 more outliers than the creative guru (if that person is still employed after a few “misses”).
Put another way: volume scales far more efficiently and far more resiliently than expertise.
Even among smart, savvy advertisers who understand ergodicity and allocation, there’s one tenant from the above philosophy that they don’t get: feeding the bulls. Scaling is (perhaps) the most terrifying thing to do in media buying or investing: the entire concept is predicated on pushing progressively more capital into something as it’s rising, all with the knowledge that, if it goes boom, you stand to lose quite a bit.
But this is why I advocate for cost caps / bid caps / tCPA / tROAS in virtually every campaign: these targets serve to de-risk follow-on investment, as when the platform can no longer deliver volume at or above your desired return level, it stops spending.
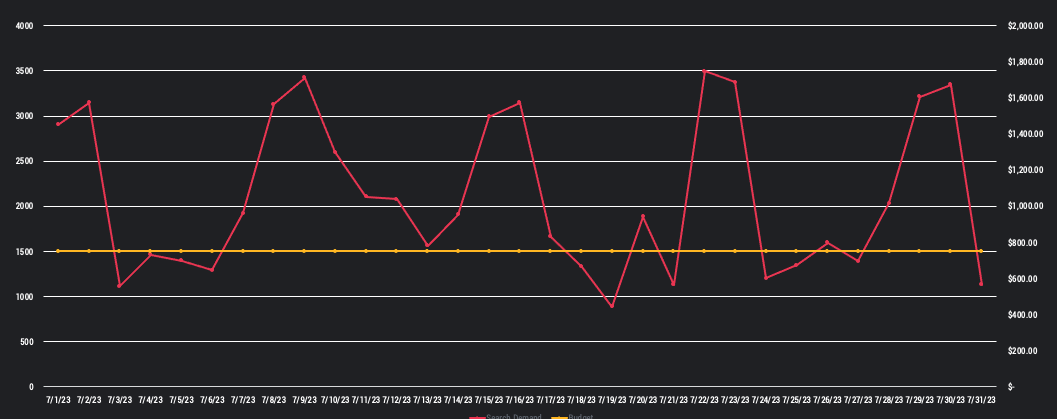
Thus, the only thing you (the advertiser) need to do is ensure that winning creatives are NOT budget constrained and that the data from the website is flowing properly to the ad platforms. This avoids situations like the below, where an advertiser missed out on hundreds of thousands in conversion volume, simply because of daily budgets:
In this chart, the area below the red line and above the gold line represents impressions with an expected value equal to or greater than this advertiser’s Minimal Acceptable Expected Value (“MAEV”), which the advertiser could not acquire because of a budget constraint. Conversely, the area below the gold line and above the red represents days where there was not a sufficient supply of qualified impressions to spend the advertiser’s budget.
The entire area above the gold & below the red is money left on the table because of an unnecessary constraint. For an advertiser similar to this one (I used anonymized data here), this could represent hundreds of thousands of dollars in unrealized contribution dollars (not revenue!) – and this is just one month. Over the course of a year, that could be $2M, $3M or even more in bottom-line dollars that went un-captured, all for the sake of an unnecessary budget constraint.
Yes, scaling is scary. Yes, you will have some misses. This is no different than a hand where you raise aggressively, only to get caught with your pants down (or just beaten by bad luck or an extremely low-probability hand), or investments that initially look golden, only to nose-dive (hello, Peloton).
The key to success is to continue to invest aggressively in winners, to right-size your bets to your budget, and - most importantly - to avoid ruin.
If you can master these three concepts, you’ll be a much better advertiser (and investor) than most - and that alone is 90% of the battle.
Until next week,
Sam
Loving The Digital Download?
Share this Newsletter with a friend by visiting my public feed.
Follow Me on my Socials