Happy Sunday, Everyone!
For this week’s issue, I want to dust off a slide - and a concept - I started writing about in 2016, then shared at events over the next 3 years:
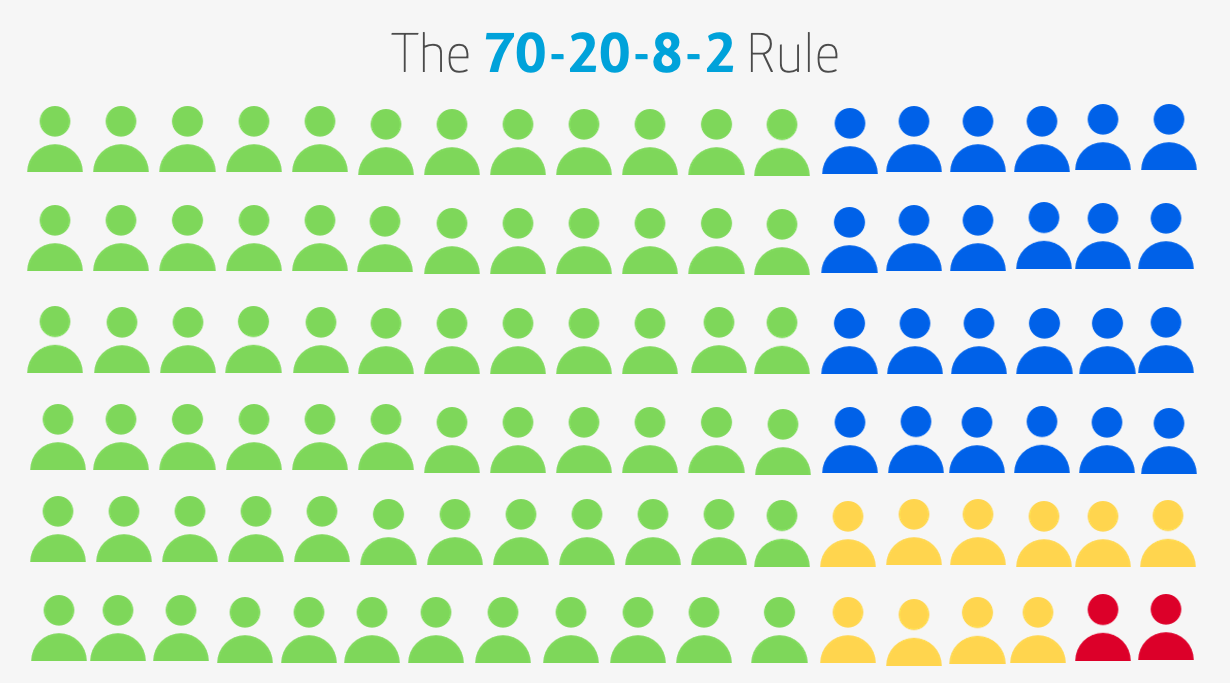
From this slide alone, it’s obvious that neither pithy titles nor graphic design were my calling. I’ve secured professional assistance, and this is the current version:
The data used to generate this slide came from millions of website visits across hundreds of accounts – all of which surface a substantially-similar pattern – one that John Dawes wrote about in 2021 called the 95:5 rule.
Put simply, the 95:5 rule states: “~95% of people, organizations or entities who visit your website or consume your content are not in the market for a specific type of good or service at any given time, leaving just 5% who are ready to buy.” In other words, the vast majority of your audience is window-shopping. Browsing. Learning. Curious, but not more than that.
What’s even more remarkable about this observation is that it (generally speaking) holds across all industries and all business lines - from eCommerce to B2G SaaS, home services to senior care, DTC to automotive, law to accounting to fintech. The implication of this is profound: most advertising - digital, email, podcast, TV, radio, billboard, whatever - is consumed by people who have a relatively low probability of actually converting into a lead, customer, sale, demo, tour, whatever. It’s even more acute for digital media, where many of us obsess about improving a conversion rate by just a few basis points.
In some ways, this should be intuitive to any marketer who has looked at analytics data over any reasonable period of time (excluding Taylor Swift’s website data, which I can only imagine is the digital marketer’s equivalent of the holy grail): global conversion rates have been steady between 1.5% and 6.5% for 20+ years. In fact, Shopify’s most recent 2024 data shows that the median conversion rate across their eCommerce stores is *still* 2.5% to 3.0% - the same range we’ve had since the dot-com bubble. We can debate the peculiarities of individual sites, businesses and industries, but the broader point holds true: most people who visit your site or consume your content do not buy, no matter how awesome it (or you) are.
Knowing that context, the question becomes: are we thinking about marketing all wrong?
Proponents of the 95:5 rule argue that “performance” marketing - the direct response, get-them-to-convert-now, connect-clicks-to-dollars marketing we’ve watched blossom from a cottage industry to a trillion-dollar ecosystem - has caused marketers to be upside down on the trade: we’re spending 95% of our resources (time, money, energy) optimizing for something that just 5% of people will do.
But is that actually correct? And - more importantly - how do we use this data point to improve how we think about and execute marketing today (and tomorrow)?
The “Undecided Customer”
In a sincere effort to not bury the lede, I don’t fully buy the 95:5 rule – not because I think the conversion data is wrong (it’s not), but because it misses the probabilistic nature of human decision-making.
Put another way, where I think Dawes’ 95:5 rule goes awry is the assumption of certainty: visitors, users, browsers, whatever are either “in-market” or they are not. They’re ready to buy, or there’s no way they’re opening their wallet. There’s no middle ground.
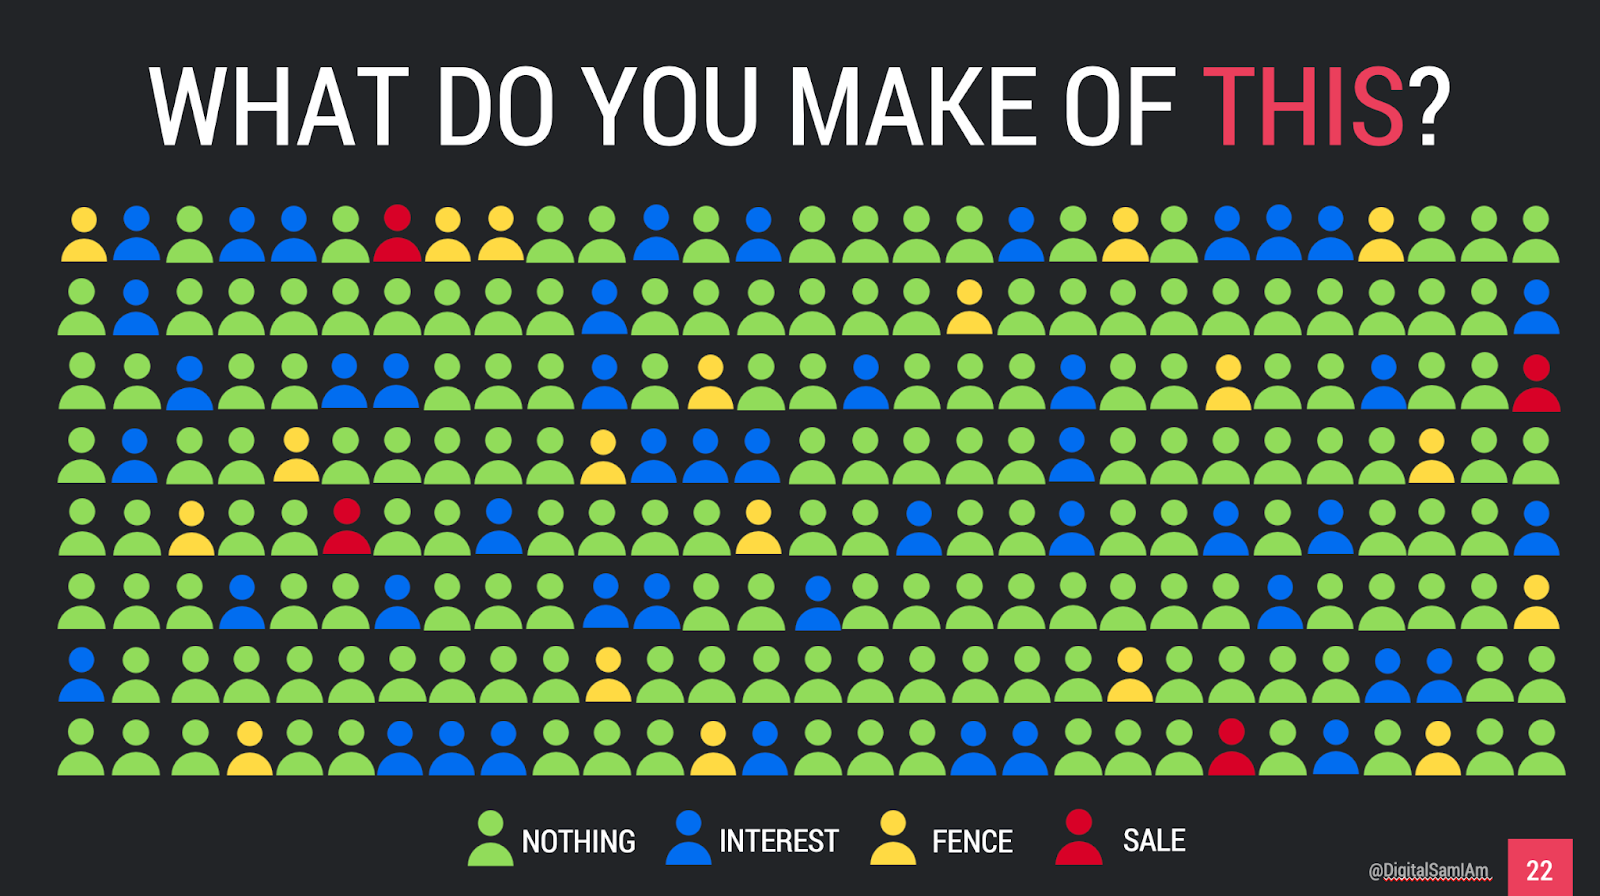
But the other thing that the same data shows us is that purchase intent is a spectrum, not a binary condition. There are people who are genuinely interested while being unsure if that interest warrants further action – the commercialized/capitalistic version of the mythical undecided voter.
And, in our data sets, those “undecided” visitors comprise anywhere from 7% to 15% of the total pool of website visitors. These are the people who add items to the cart, but don’t initiate the checkout process; the people who start the form, but don’t complete it; the people who read your in-depth PDF, watch the demo video, bookmark your site - you get the picture.
A step lower in the “intent” spectrum are the people who have genuine interest in your product/service/solution, but lack any sort of immediate commercial intent. In retail, they’re referred to as window shoppers. Browsers. Depending on your site and industry, the “interest” group is another 15% to 25% of your audience. And what’s left - the final 55% to 73% - are the next-to-no-intent traffic. They may be looking for a job, they may be looking for knowledge, they might arrive only to find that what you have to offer isn’t what they’re seeking. But while their intent level is low, it isn’t zero.
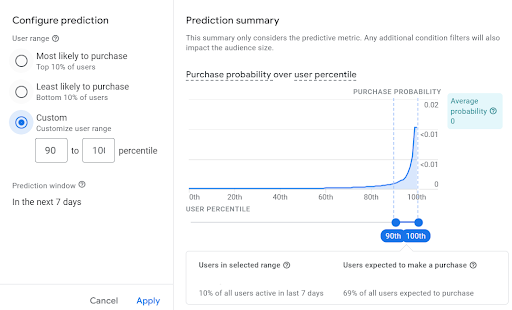
There’s perhaps no better illustration of this distribution than GA4’s Conversion Probability Report (it’s only available for eCommerce sites right now, but should expand to lead gen):
This is a long winded way of saying: I think we’re all looking at marketing the wrong way.
The goal isn’t to obsess about the 5% with sky-high conversion probability - candidly, there’s little you can do (outside of ensuring the functionalities by which they give you their money or information are operational and reasonably simply to use) to impact their purchase probability. Sure, you can accelerate it with a killer offer – but the reality is that they’d purchase/inquire/whatever anyway. You’re just catalyzing that activity with your offer - and that’s not a bad thing. Cash flow + lead flow are the lifeblood of organizations. But it’s vital to be intellectually honest about what we’re doing.
On the flip side, your goal isn’t to obsess about the 95%, either – to “be bold” or “create memorable connections” or whatever. As we’ve seen - quantitatively and qualitatively - that 95% isn’t a ubiquitous bloc; it’s a lot of people with a lot of different intents and interests.
So, what?
I’d argue that all marketing should three overarching objectives:
- Increase the conversion probability of the “fence sitters”
- Maximize the total expected value of your audience
- Minimize paid expenditures on the near-zero probability audience
Do those things & you’ll be immensely, wildly successful.
Fence Sitters Are Where Marketing Earns Its Keep
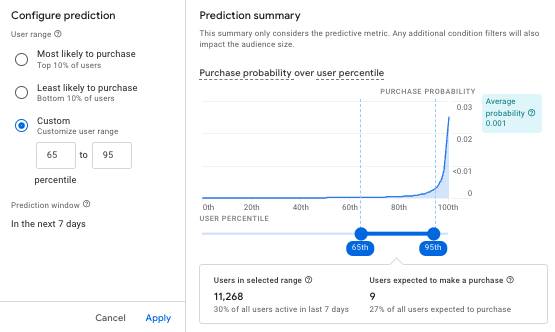
I firmly believe most organizations would be better off building an audience in GA4 of the users in the 65th to 95th percentile of conversion probability, and focusing all of their efforts exclusively on these people.
Why?
Because the users in the top-5% are the ones who are staggeringly likely to convert. Moving 5% of your user base from a 70% to a 75% conversion probability, for a website with 100,000 visits/month, effectively increases sales by (100,000*.05*.075)-(100,000*.05*.070) = 250 conversions/month.
And yes, 250 more transactions per month is great. At a $100 AOV, that’s an extra $25,000 - certainly nothing to sneeze at. But if that improvement comes at the cost of hundreds of hours of staff time and a few thousand dollars in ad spend, is it worth it? On a total return basis, probably not.
One of the things that is abundantly clear from our data is that conversion probabilities fall quite heavily once you get outside the top ~5%:
For most sites, the total expected number of conversions (leads, sales, demos, etc) from this “fence” + significant interest group - 30% of your total audience - is approximately equal to the expected number of conversions from the top-5%. It’s an extreme power law.
The opportunity here is massive. Take the same details from above - a site with 100,000 visitors per month, and increase the conversion probability from 0.05 (5-in-100 visitors converts) to 0.10 via strategic, well-designed marketing. Candidly, this requires about the same amount of effort as increasing the top-5% from 0.7 to 0.75. The return, though, looks quite different:
(100,000*0.30*.10) - (100,000*0.30*.05) = 1,500 conversions
That’s transformational. It’s six times higher than the return produced by focusing only on the top-5%. And because these are the people that are curious, interested (often highly) or on the fence, the total conversion volume is sufficient to justify the expense. Going from a 0.001 to a 0.002 conversion probability - the same level of increase on the bottom-65% of the audience - nets only 65 conversions under the same conditions. Marketing can’t boil the ocean. Marketing shouldn't boil a hot tub. But marketing can heat up a pool. That’s what we’re doing here. We’re taking something that’s somewhat warm and making it near-optimal – and in the process, we’re driving significantly more incremental revenue/leads/demos/whatevers.
The people who were going to buy, were always going to buy.
The people who were never going to buy, were never going to buy.
But the people in the middle? They can be influenced by marketing communications. They can be persuaded by offers. They can be nudged off the fence and into the customer/client/prospect pool.
Focus your efforts on that.
Create Something For Everyone
If you’re with me so far, your next question is probably along the lines of, “How do we do it?”
In the spirit of Socrates, I posit the following question:
If I told you that 95 out of every 100 people who visited your landing page would be curious about your content, but unlikely to buy in that moment, what would you change about that page? How would you modify it? What would you do differently?
When phrased that way, most marketers come back with suggestions along the lines of:
- Include softer conversion points - email/newsletter sign ups, longer-duration coupons, links to downloadable resources, helpful guides, etc.
- Integrate diagnostic tools - create mechanisms to help people on the fence understand if this product/service/solution is right for them (and if it isn’t, provide a way to get them to a better-fit option). This could be a calculator, a quiz, an assessment, etc.
- Storytelling + Explainer Elements - craft a story around the product/service/solution, along with examples and proof points (testimonials, case studies, statistics, star ratings, press coverage, reviews, etc.), to help users better understand what it is that’s being offered.
- Link To Other Resources - yes, landing pages are supposed to convert – but if that’s off the table for some segment of the audience, what’s the next best thing? If my options are either (a) user visits my lander, decides it isn’t for him/her + leaves or (b) user visits my lander, decides it isn’t for him/her, but goes to another article or video or graphic I’ve created, which one seems preferable? Winner, winner option B dinner.
What do all of these changes have in common? They create something for everyone. The user who is curious can learn more about solutions. The person on the fence gets something (a guide, a coupon, whatever) in exchange for an email. The individual who is very early in the purchase journey is offered a low-to-no cost route to education. And the people who have absolutely zero intentions of ever buying? They leave all the same.
The functional result of implementing these kinds of strategies on your landers (and across your site) is maximizing the expected value of your audience.
While these tactics can (and often do) increase your end goal conversion rate (leads, sales, etc.), the primary benefit is increasing the size of your future 5% audience (this is the crux of Dawes’ argument) across your entire portfolio of offerings. This is a long-term game. It requires understanding that successful marketing is a delicate balance between growing the pool AND capturing the available share, between economic value creation and actual value capture.
Probability Theory & Expected Value
In the same decks as that horrid-looking slide, I shared a few others:
These are initial attempts to quantify all of this activity in two buckets: expected value and transaction value, then express all of it in net-present terms. To do this, we expand tracking to include goal completions (email sign ups, tool uses, resource downloads, etc.) along with transactions (sales). For each goal, we’ve assigned a value based on the incremental impact of a user completing that action on their value to the business.
Simplified: if users who (for instance) sign up for the email newsletter tend to convert to a paying customer at a 6.5% rate while those that do not only convert at a 4.25% rate, and if our email subscribers have an AOV of $150 while non-subscribers have an AOV of $100, then we can conduct a preliminary valuation of the impact of signing up for an email:
Email Sign Up: 1*0.065*$150 = $9.75
No Email Sign Up: 1*0.0425*$100 = $4.25
Expected Economic Impact (Value) of the Email Sign Up = $9.75 - $4.25 = $5.50
Does this mean that every single email sign up is worth exactly $5.50 to this hypothetical business? Absolutely not. But it does mean that, over a sufficiently large sample, that you should reasonably expect users who sign up for the email to be worth more to your business than those that did not.
This need not be a fancy, complex exercise – but it is often a worthwhile one for many organizations to conduct: compare the performance of audiences that triggered (what you believe to be) a value-creating event with those that did not trigger the event. Select the top-3 or top-5 events with the highest correlated impact. Track them.
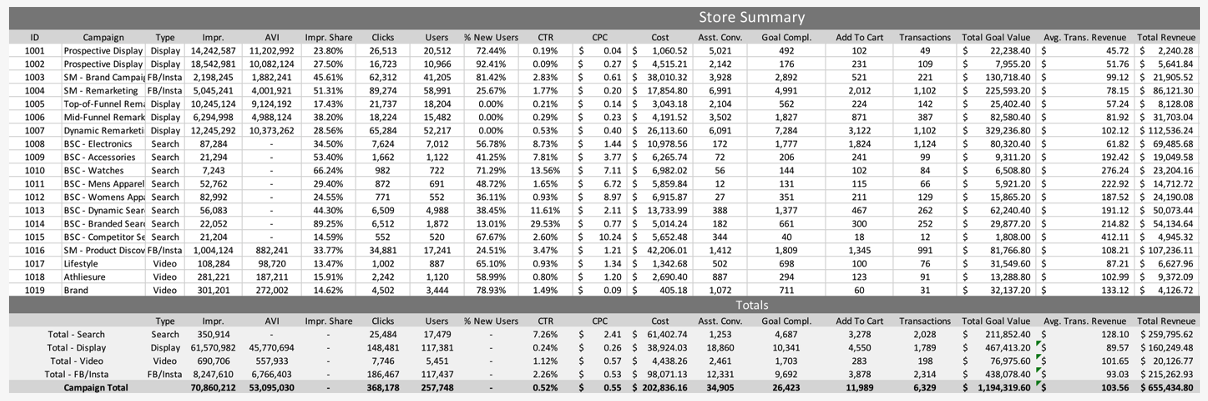
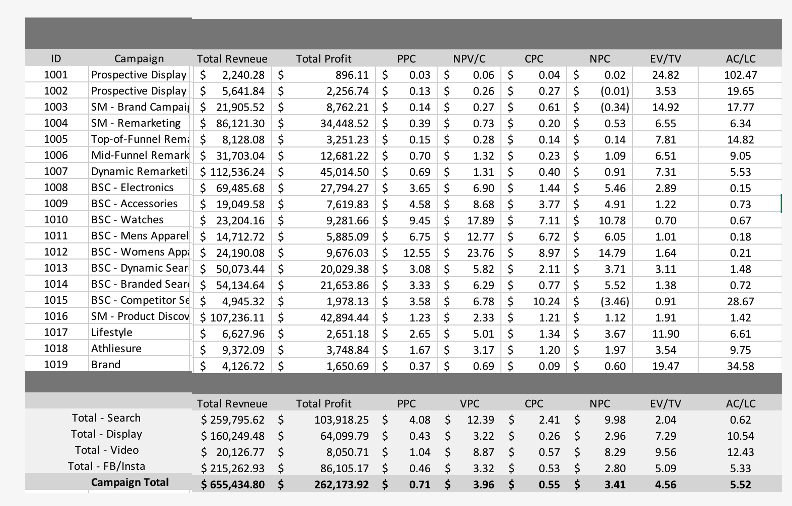
The result of doing this is objectively wonderful: it unlocks a new evaluation mechanism for less direct marketing, which is exactly what you see here:
A quick aside for those unfamiliar:
- Total Profit = Total Contribution Dollars
- PPC = Profit Per Click (Contribution Margin Per Click - Cost Per Click)
- NPC = Net Present Value Per Click
- CPC = Cost Per Click
- NPV/C = Net Present Value per Click - CPC
- EV/TV = Economic Value divided by Transaction Value
- AC/LC = Assisted Conversions divided by Transactions
These are not the metrics most marketers are accustomed to seeing, but they can be quite valuable when used in the right context. For example, I can see that prospecting campaigns are dreadful at driving sales, but quite adept at driving other goal completions (like those email sign ups). Those sign-ups can then be nurtured via flows (much cheaper than paying to re-acquire traffic all over again!) and converted into customers at a subsequent point in time.
To tie everything together, the expected result of executing the strategy I’ve outlined above - focusing on the fence sitters + those who have interest, but aren’t quite sure - should be an increase in your net present value per click. You should see more economic value created. And, ultimately, that economic value should convert at a reasonably stable rate into transaction value (or actual, captured value).
All of this is possible when you stop obsessing about the top-5% and start thinking more holistically about maximizing the expected value of your audience.
Enjoy the last weekend of August & Happy Maximizing!
Cheers,
Sam
Loving The Digital Download?
Share this Newsletter with a friend by visiting my public feed.
Follow Me on my Socials